MetOceanViewer
4.2.0
Size: 55 KB
Downloads: 2559
Platform: Windows All

If you live anywhere near the ocean and you're passionate about science, then you will definitely want to have a look at MetOceanViewer. This piece of software provides you with up-to-date information from NOAA and USGS stations, and it can do a few interesting things, like plotting data, creating hydrodynamic modeling files or generating tide prediction through XTide and much more. It's an excellent pick if you're interested in hydrodynamic model data.
MetOceanViewer is free and open source, and improvements are still being made at the time of writing. It has a small setup package, so it won't take long to download it and install its components on your computer. There are no complicated settings to be made along the way, and you don't have to meet any special requirements.
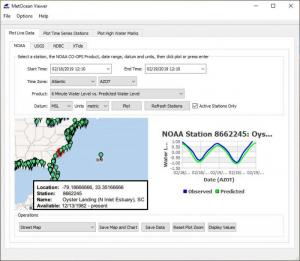
The software's controls are organized on several tabs and sub-tabs, on which you can plot live data, time series stations, as well as high water marks. If you want to plot live data, you can retrieve it from NOAA, USGS or NDBC stations, and you can also create tide predictions with data from XTide stations. In all cases, the process involves selecting a station on a map, making a few simple tweaks and clicking a button to plot the data. For example, if you want to plot NOAA data, you can pick one of many stations from around the US, choose a time zone, and decide what kind of information to process. You can set the application to plot a 6-minute water level and compare it to predicted water levels, plot wind speed information, air temperature and much more.
When it comes to plotting time series stations, the software can work with various file types, including ADCIRC, which you can retrieve from the aforementioned research stations. Furthermore, you can import multiple files, if you want to compare observations and predictions for example. Also, you can plot the processed data on a map, to make it easier to visualize.
High water marks can be plotted from HWM files. All you have to do is import such a file through a standard browsing option and click a button. Additionally, you can customize the colors and classifications of the markers and make other fine tweaks, to make a map according to your own preferences.
MetOceanViewer has everything you need and more if you're interested in any hydrodynamic data modeling.
Pros
You can retrieve live data from various NOAA and USGS research stations. The software can plot data in just a few seconds, and it can generate graphs and map representations.
Cons
You may need a few minutes to figure out how to use the application properly.
MetOceanViewer
4.2.0
Download
MetOceanViewer Awards

MetOceanViewer Editor’s Review Rating
MetOceanViewer has been reviewed by Frederick Barton on 20 Feb 2019. Based on the user interface, features and complexity, Findmysoft has rated MetOceanViewer 5 out of 5 stars, naming it Essential